
Positive and Negative Predictive Values in Test Results (Prevalence 0–100%)
Author: 00alphaExecutions: 1513
※ This library was created by a member. This site is not responsible for its content.
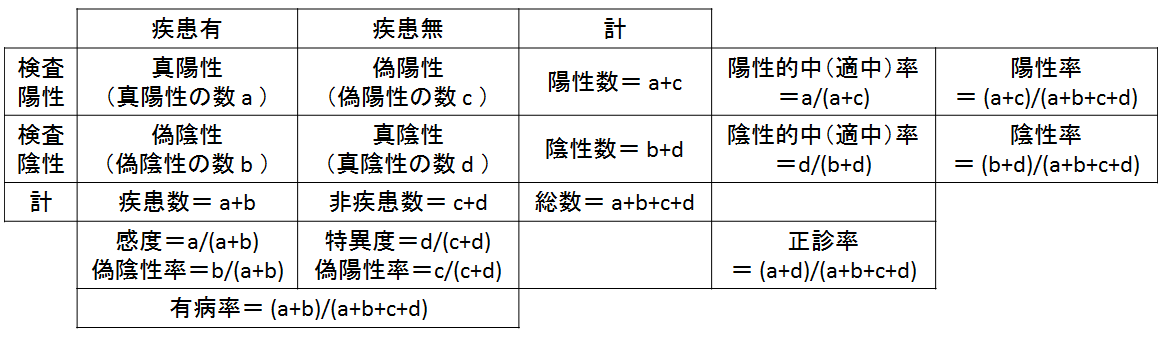
Calculate the positive predictive value and negative predictive value for test results within a prevalence range of 0–100%, and display them in graphs and tables.
Positive predictive value = Sensitivity × Prevalence / (Sensitivity × Prevalence + (1 − Prevalence) × (1 − Specificity))
Negative predictive value = specificity × (1 – prevalence) / (specificity × (1 – prevalence) + prevalence × (1 – sensitivity))
Negative predictive value = specificity × (1 – prevalence) / (specificity × (1 – prevalence) + prevalence × (1 – sensitivity))
No customer feedback for this calculation yet.